
| WTT User's Guide | ||
|---|---|---|
| Previous | Web Application Interface | Next |
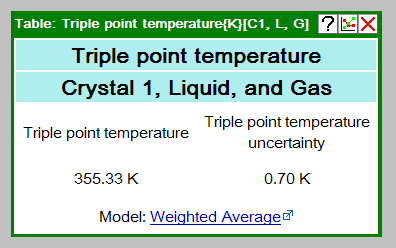
For single-valued properties, such as the triple point temperature or critical
pressure, the initial window displayed is a simple table
of the property value and uncertainty. At the bottom of the window, a link is provided to the underlying
mathematical model used to determine the value. Any underlying experimental or
predicted data are accessed through the Graphical Plot button
( ) in the upper right of the Window Toolbar. The plot compares those data against the recommended value.
| Previous | Home | Next |
| Site Menu Bar | Up | Specifying Ranges for a Data Table |
©2012 copyright by the US Secretary of Commerce on
behalf of the United States of America. All rights reserved.
Privacy Policy/Security Notice/Accessibility Statement/Disclaimer/Freedom of Information Act (FOIA)
The TRC Group is part of the Thermophysical Properties Division in NIST's Material Measurement Laboratory
The National Institute of Standards and Technology is an agency of the U.S. Department of Commerce