
| WTT User's Guide | ||
|---|---|---|
| Previous | Web Application Interface | Next |
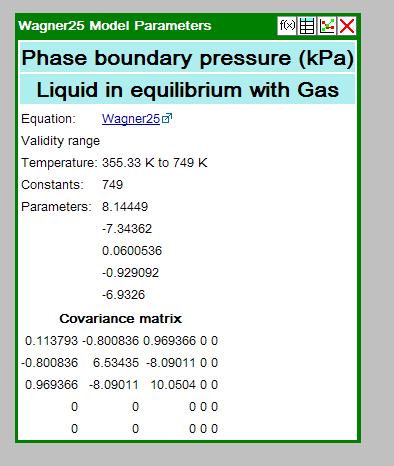
The Model Summary window displays the numerical constants of the recommended model. The property, units, and phases are specified at the top of the window. Below that, the model name and a help link are provided, followed by the ranges of applicability. Lastly, the constants, parameters, and covariance matrix are tabulated. The linked help documentation provides details for the specific model.
In general, the Window Toolbar for a Model Summary window contains buttons to access the
associated Range Specification ( ), Data Table (
 ), and Graphical Plot (
 ).
[Note: The Data Table will not contain numerical data until a calculation is
requested by clicking the Calculate button in the Range Specification window.]
).
[Note: The Data Table will not contain numerical data until a calculation is
requested by clicking the Calculate button in the Range Specification window.]
| Previous | Home | Next |
| Plot Features | Up | The Evaluation Summary |
©2012 copyright by the US Secretary of Commerce on
behalf of the United States of America. All rights reserved.
Privacy Policy/Security Notice/Accessibility Statement/Disclaimer/Freedom of Information Act (FOIA)
The TRC Group is part of the Thermophysical Properties Division in NIST's Material Measurement Laboratory
The National Institute of Standards and Technology is an agency of the U.S. Department of Commerce